Viewing the 5 GHz band in Cisco Spectrum Expert

31 Jul, 2015
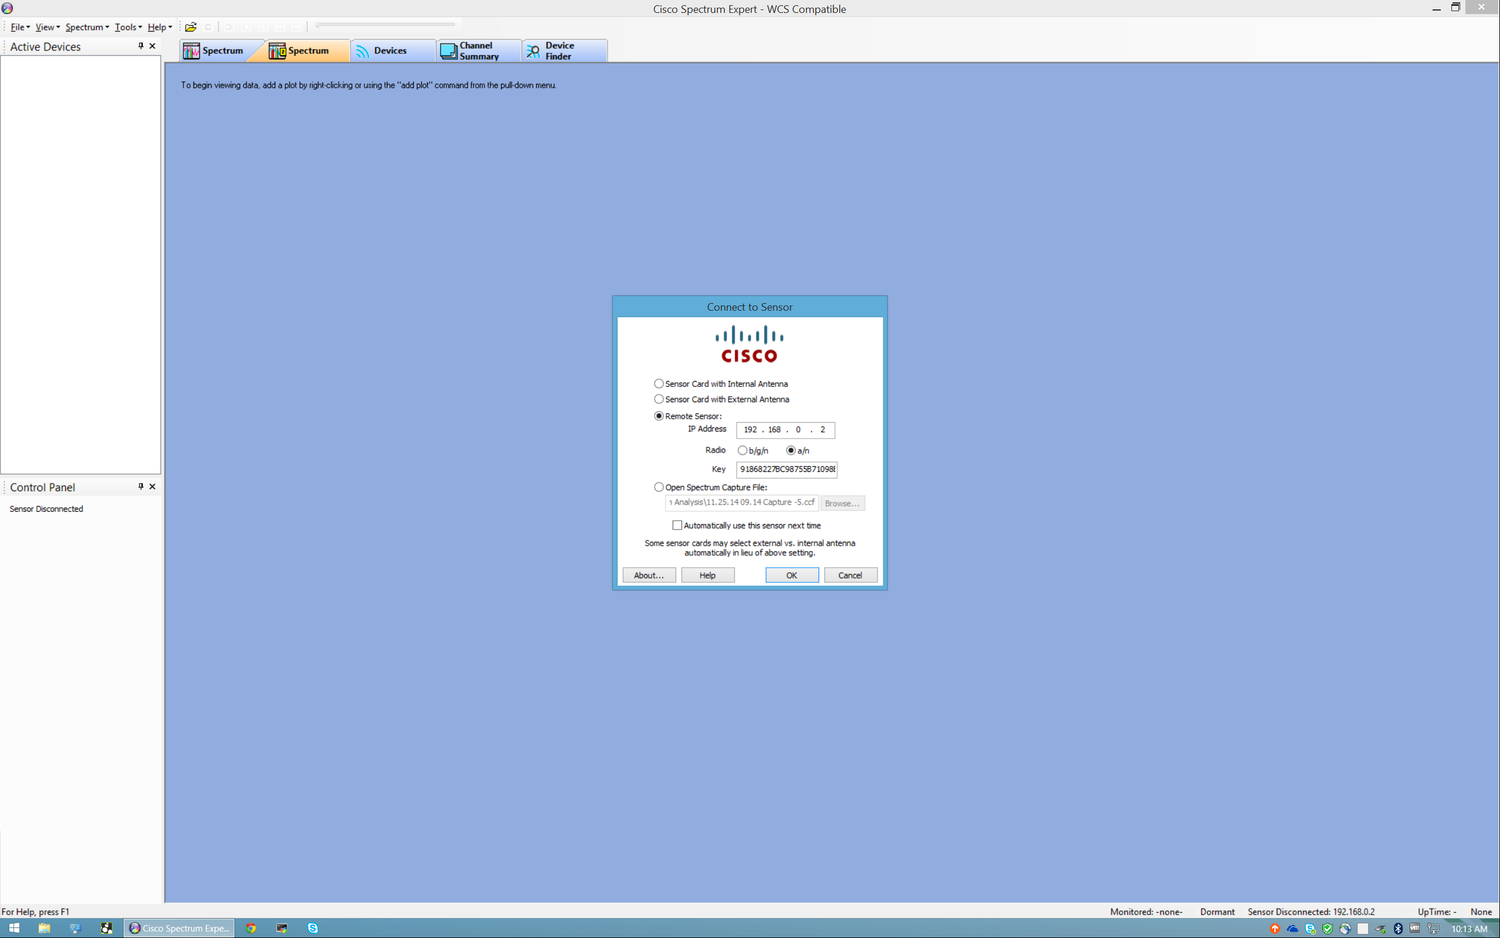
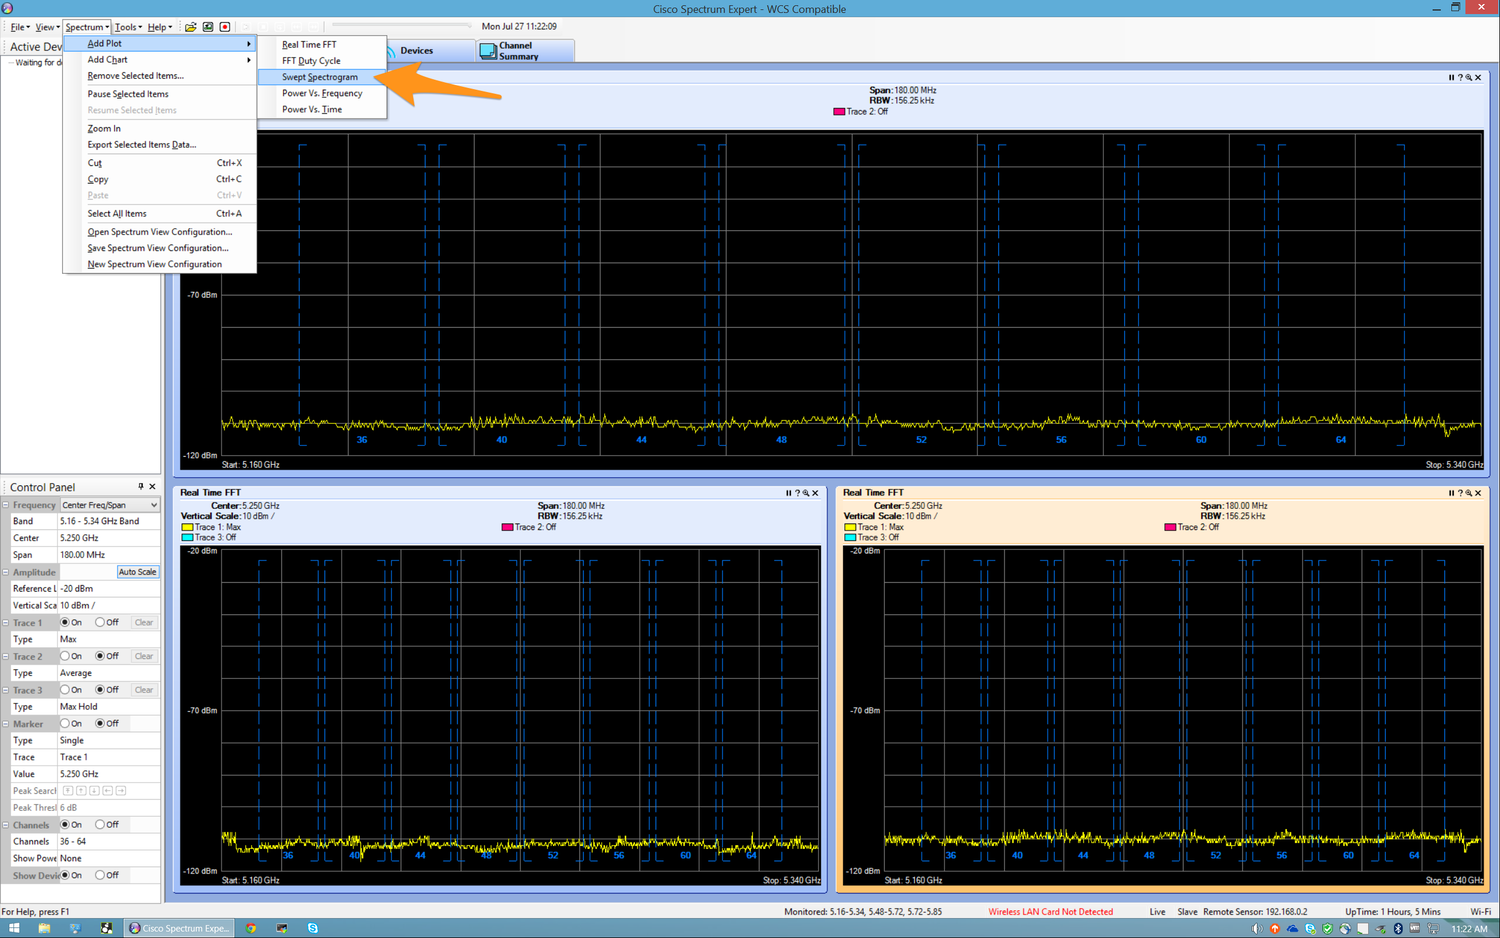
In a previous article I described a method to connect Cisco Spectrum Expert to an Autonomous Access Point operating in Spectrum Mode. This article addresses how to configure Spectrum Expert to display the data, primarily wrangling the plots to display the entire 5 GHz band on one screen.On first launch Spectrum Expert looks like this:
Paste the Remote Sensor NSI Key, select "a/n" Radio, click OK
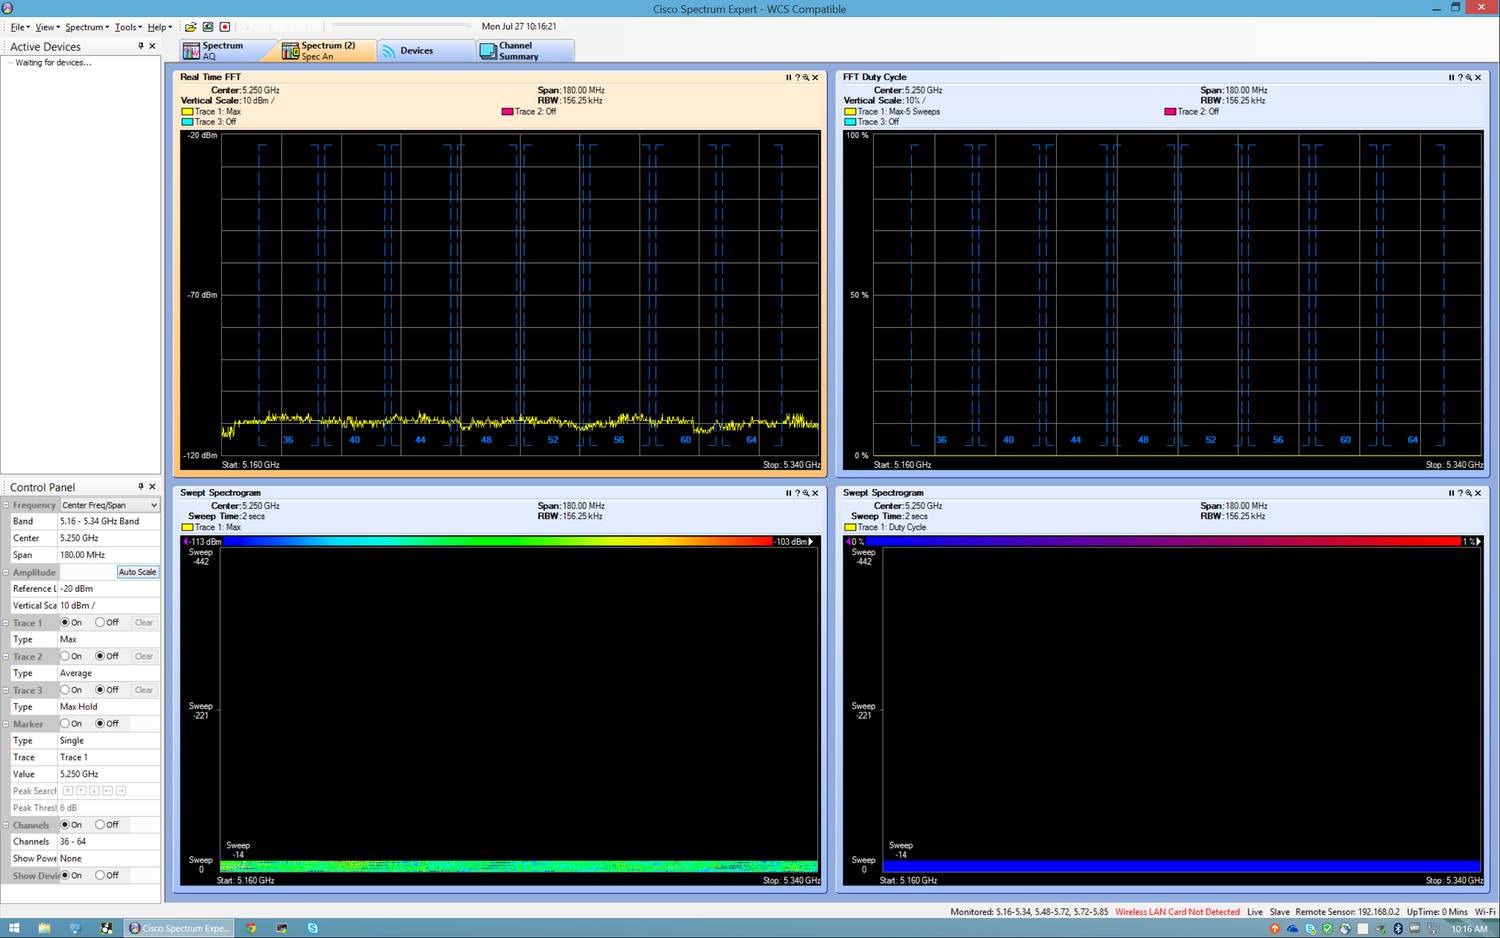
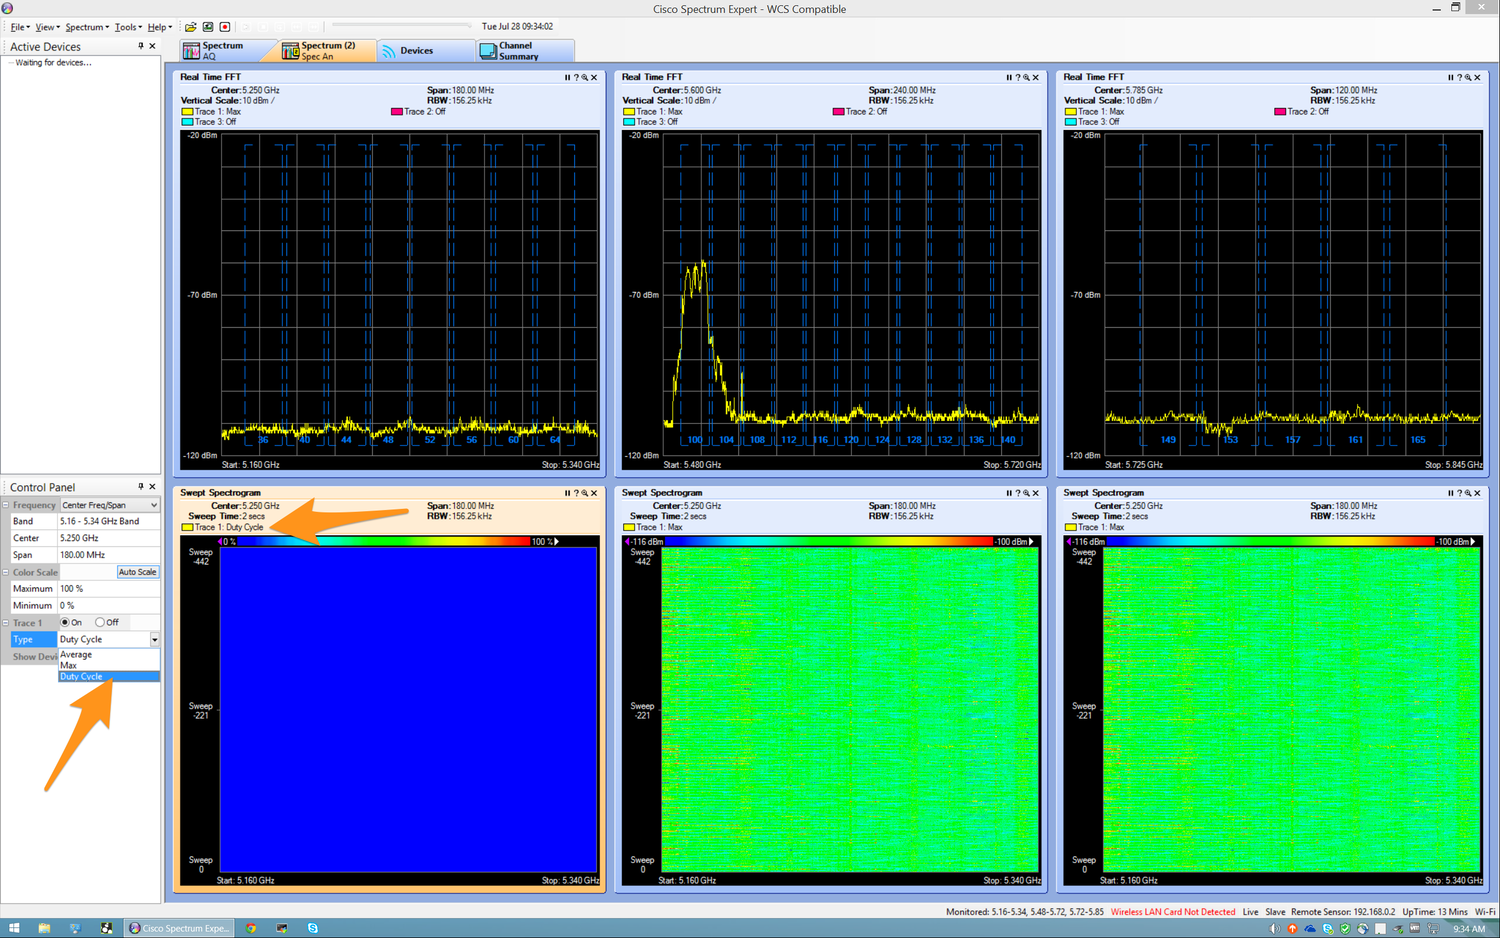
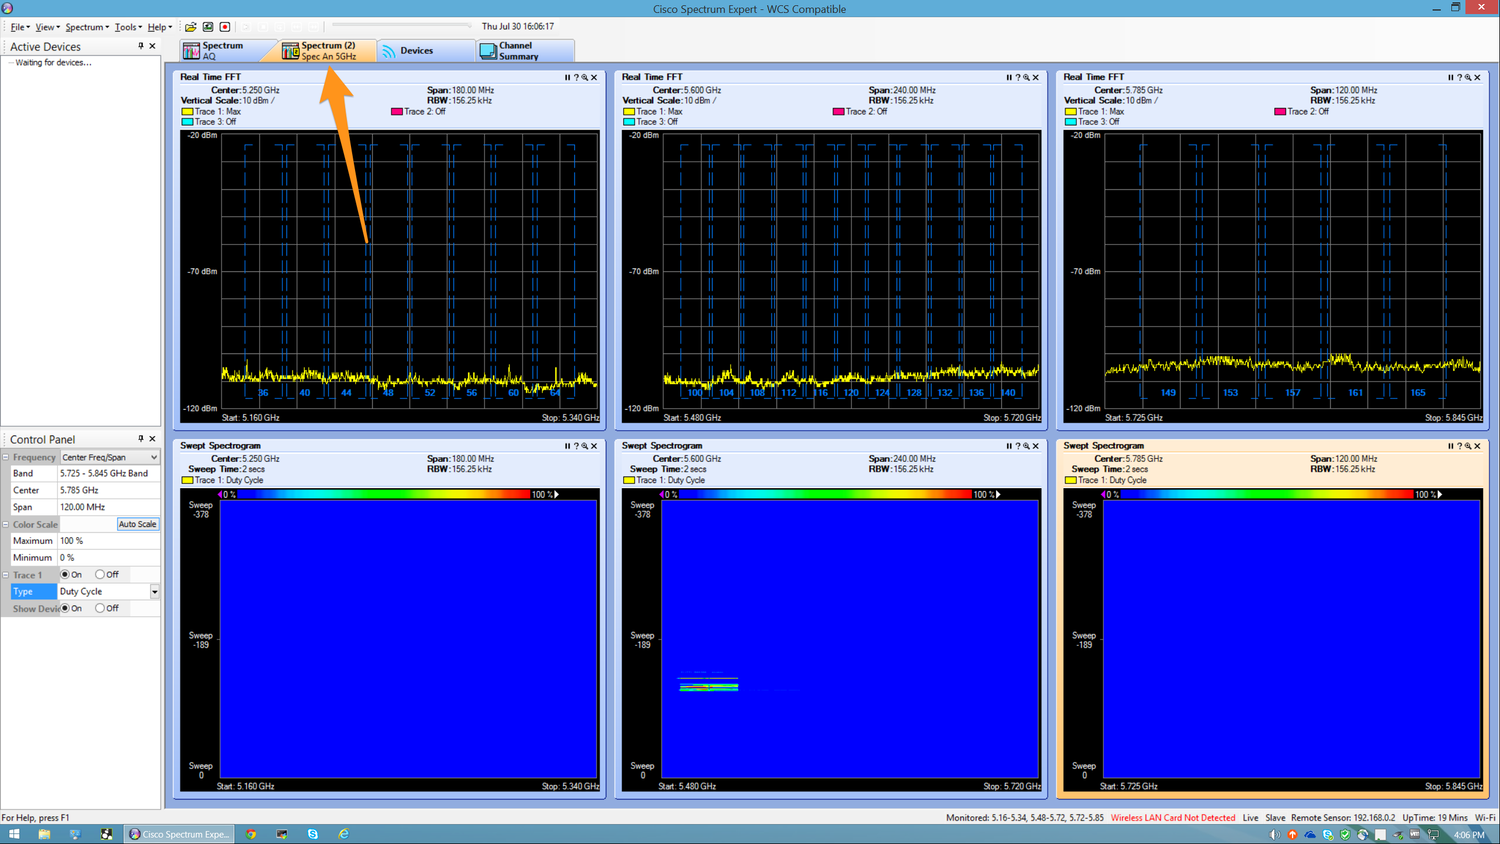
It is possible to add and remove plots from this screen. Doing so alters the position and size of the plots. For now the focus is viewing the Real Time FFT (strength of signal, this moment) and Duty Cycle Swept Spectrogram (Historical / Waterfall View) for the entire 5 GHz band.
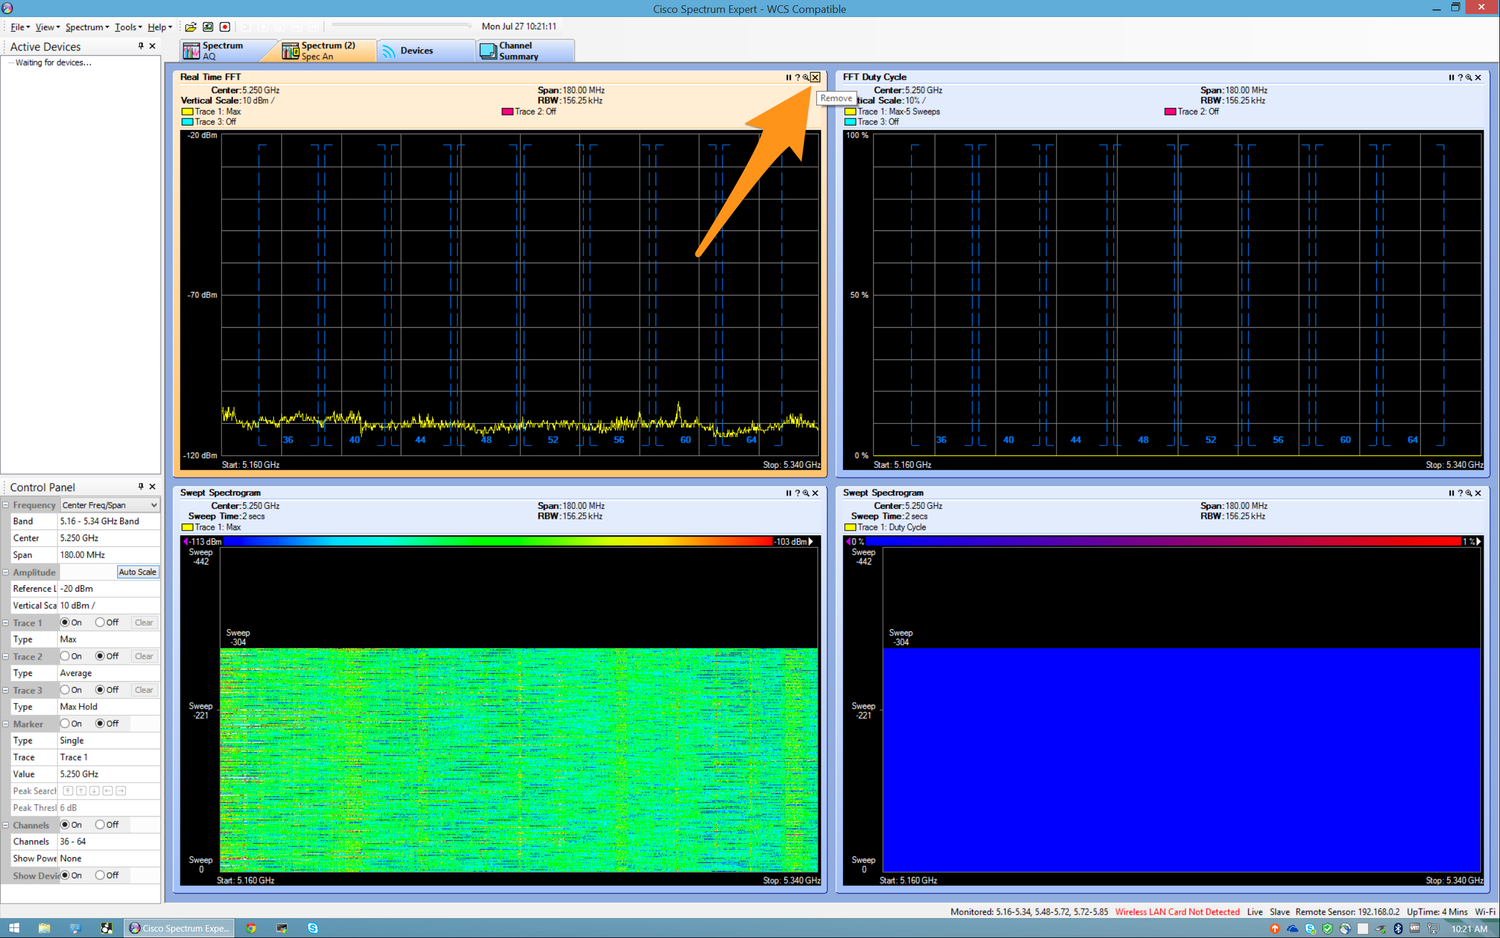
To do this, first clear the screen of all the default plots, using the "X" to remove each plot one by one.
Once all the default plots have been removed, add three Real Time FFT plots, from the menu heading Spectrum
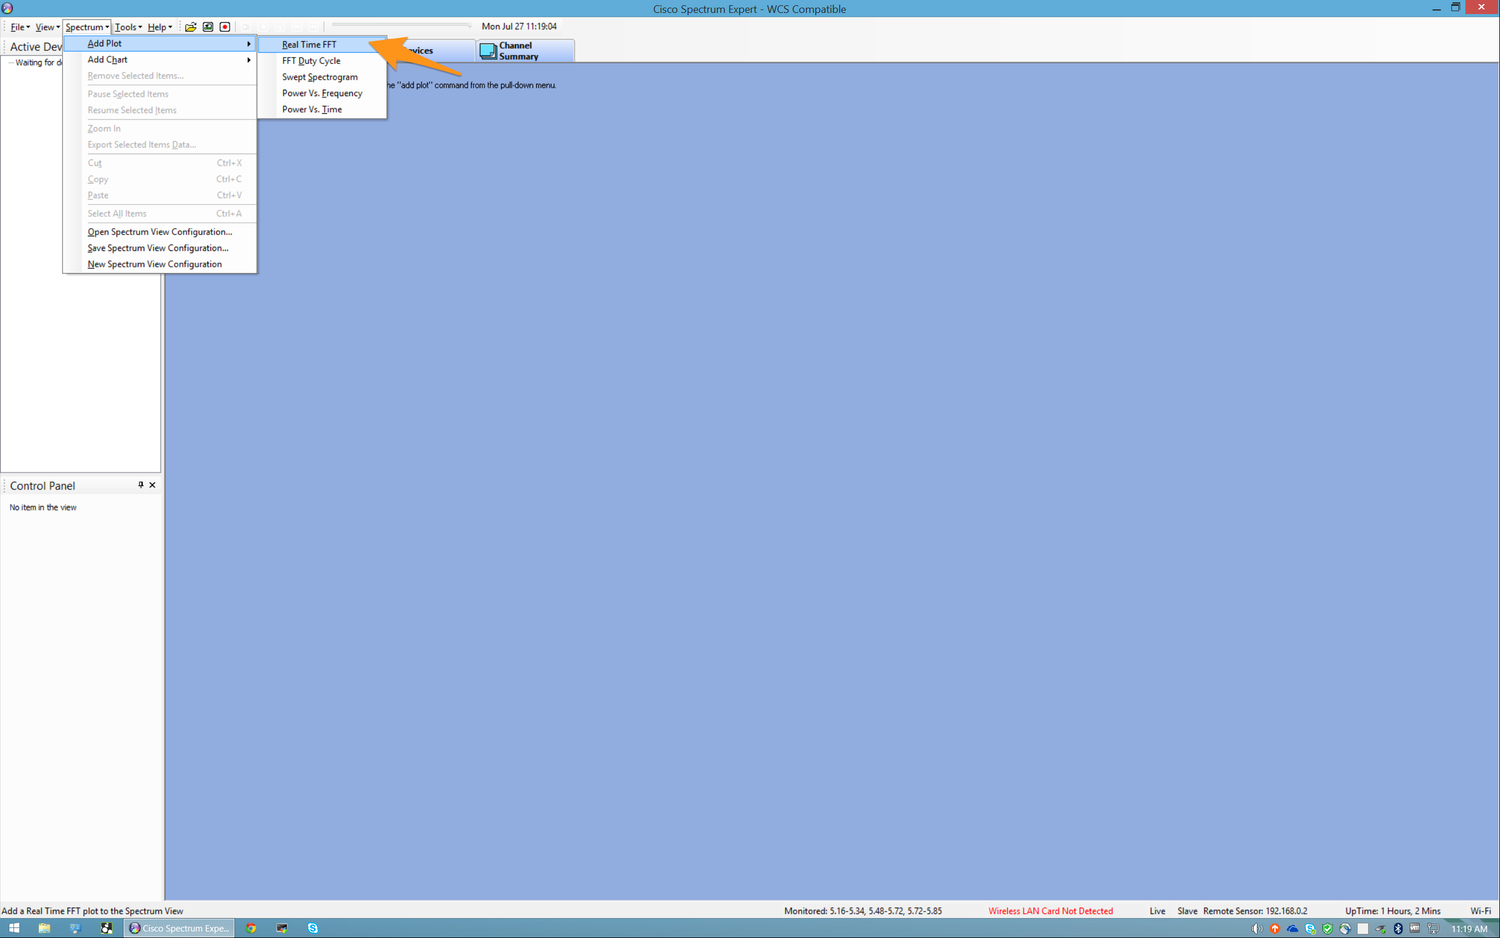
Once three Real Time FFT plots have been added, add three Swept Spectrogram plots
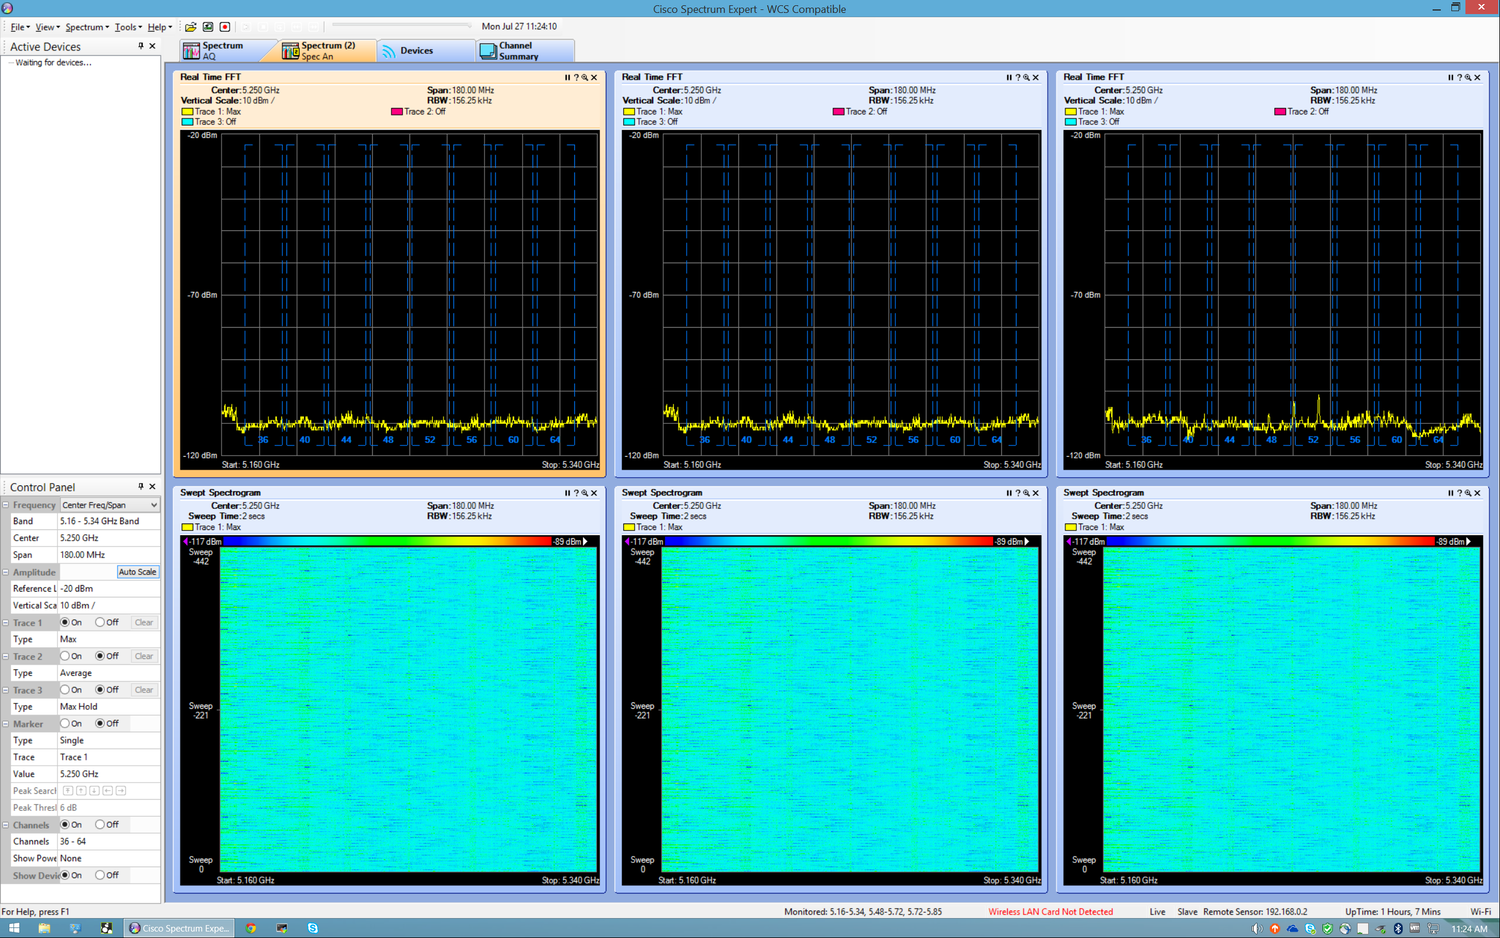
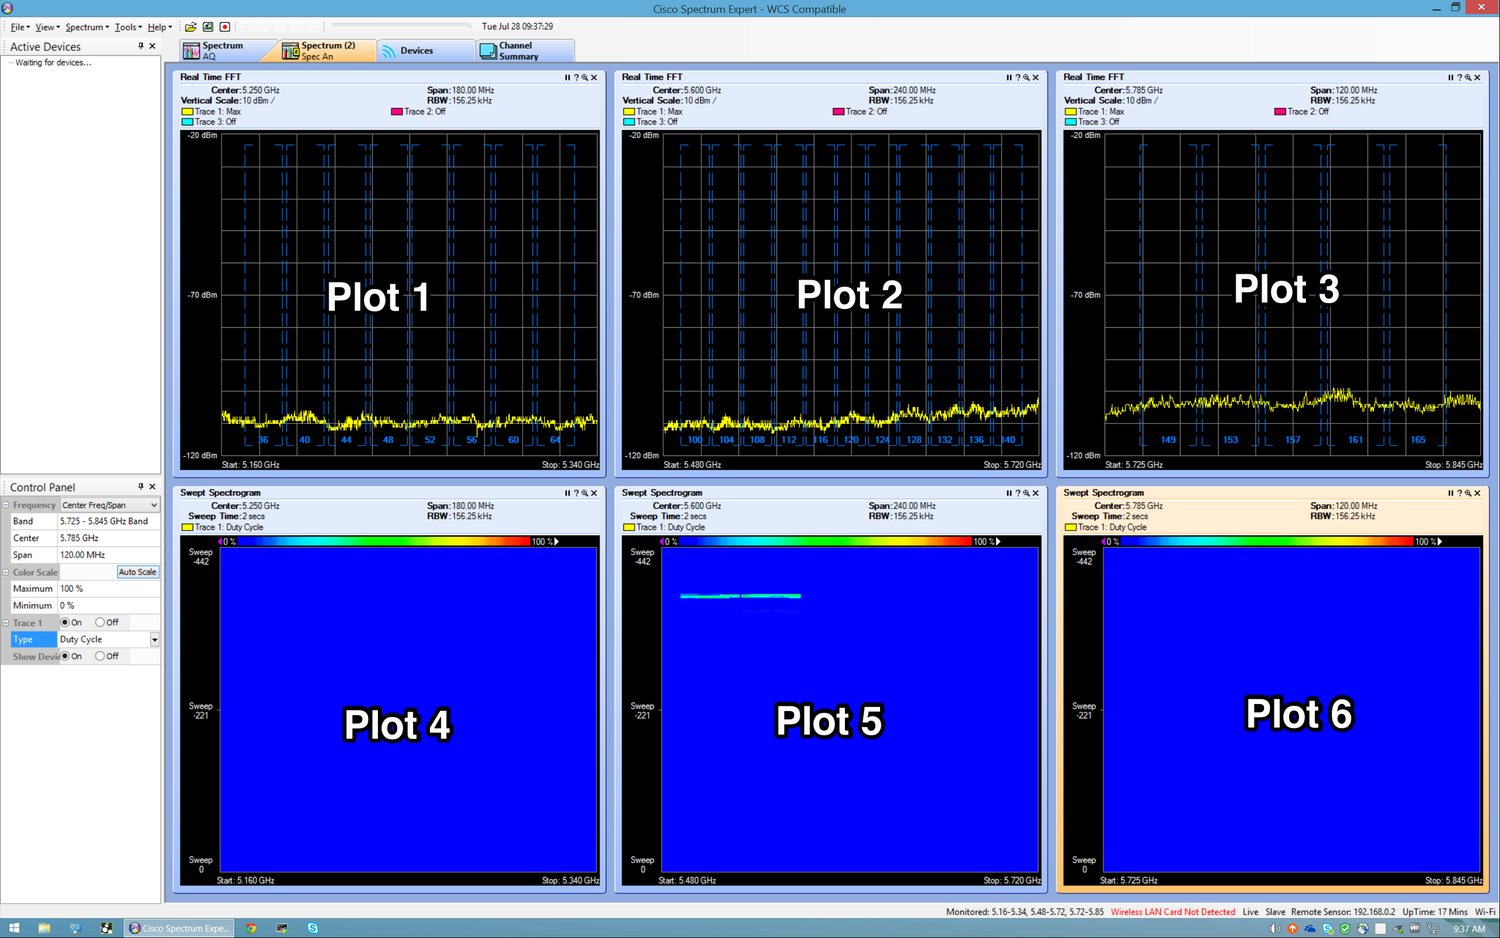
To make a selection click anywhere within the plot and the surrounding box will become a different colour
Once selected it is possible to view and change details specific to Plot 1 from the Control Panel in the bottom left corner
The fields in the control panel are selectable, though you must click on them first to reveal the drop down arrow
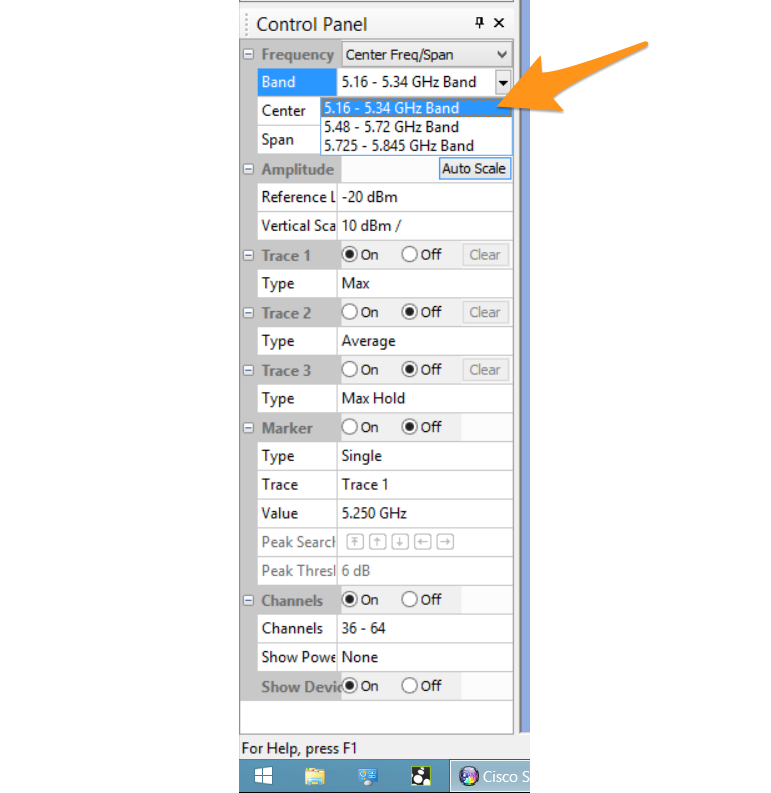
Selecting Band: 5.16 - 5.34 GHz configures Plot 1 to display both UNII-1 and UNII-2
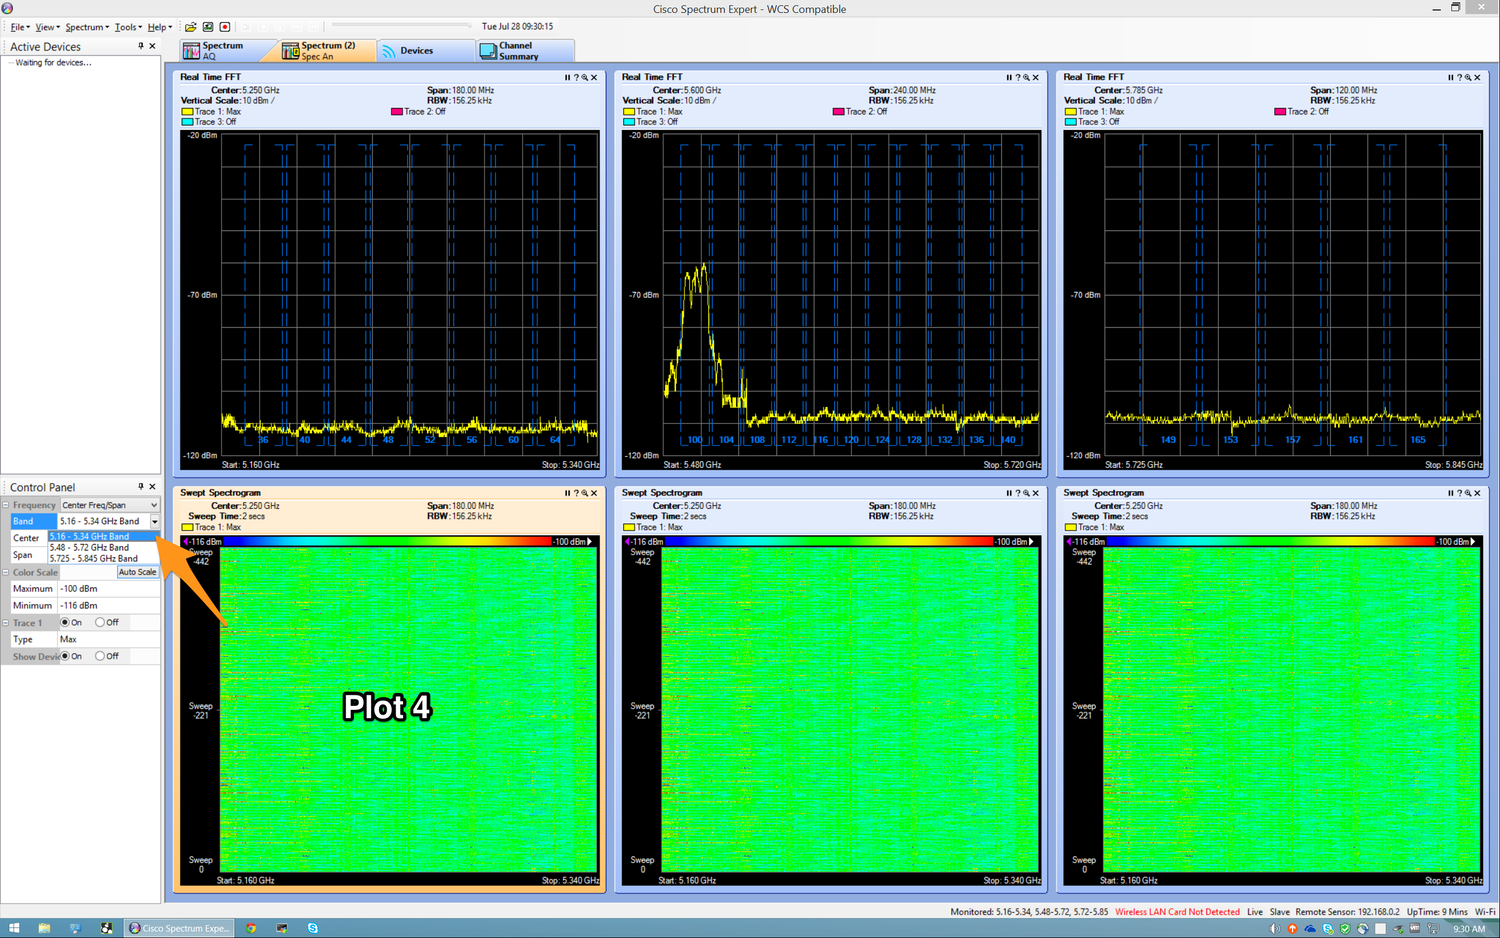
It is possible to tweak the display further, adjusting the scale, adding additional traces, what they represent, addition of markers etc. Under Channels it is possible to select which channel markers appear in the Plot or disable them.
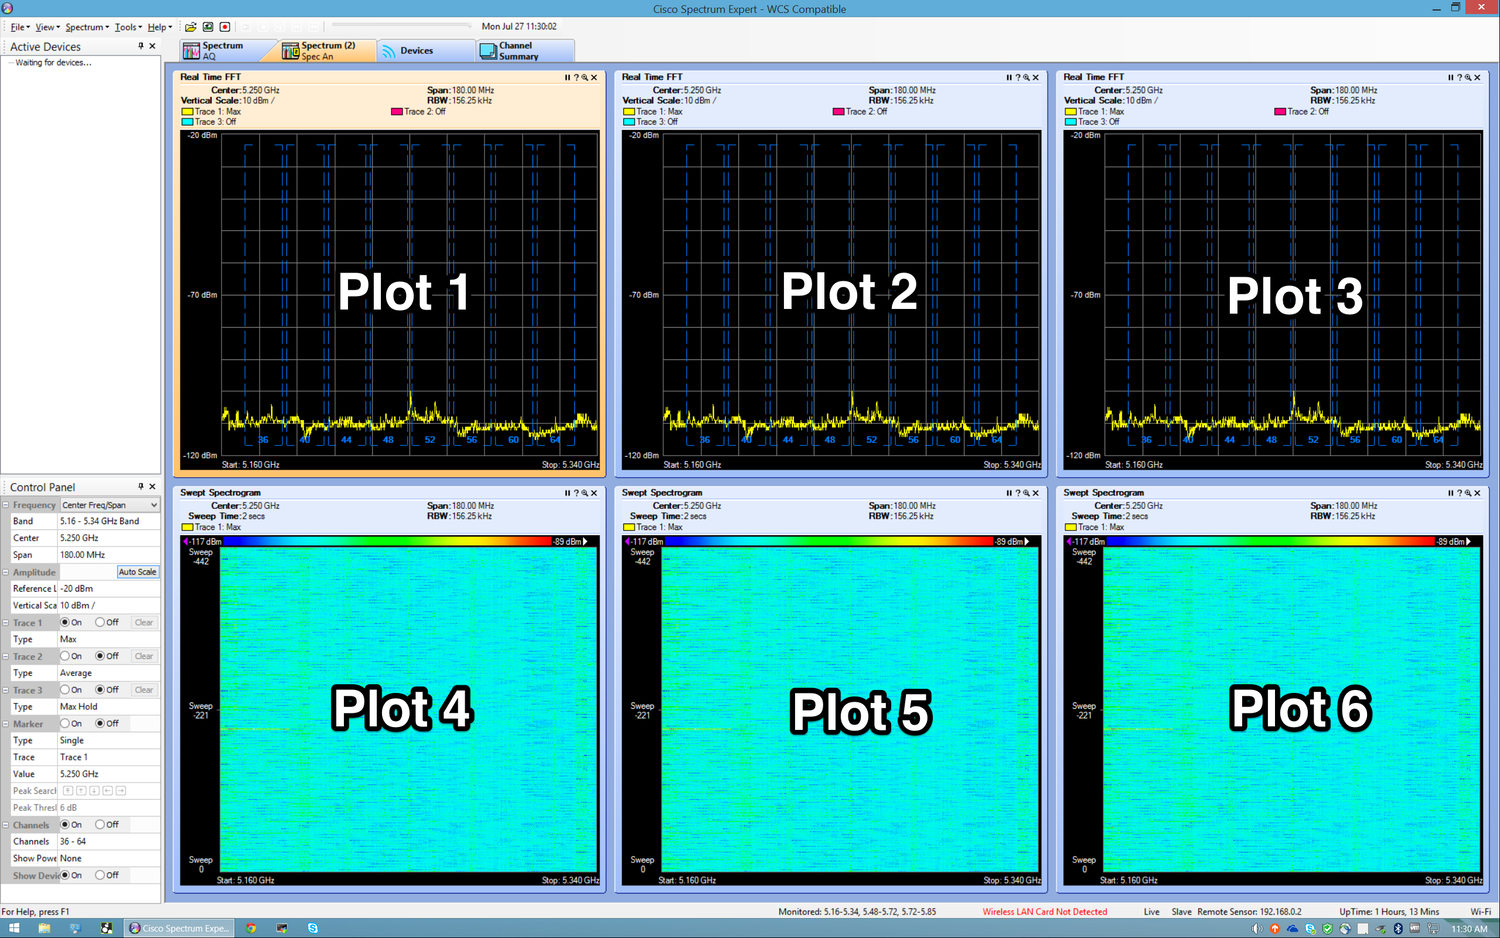
For now the only setting that requires attention is Band. On to Plot 2.
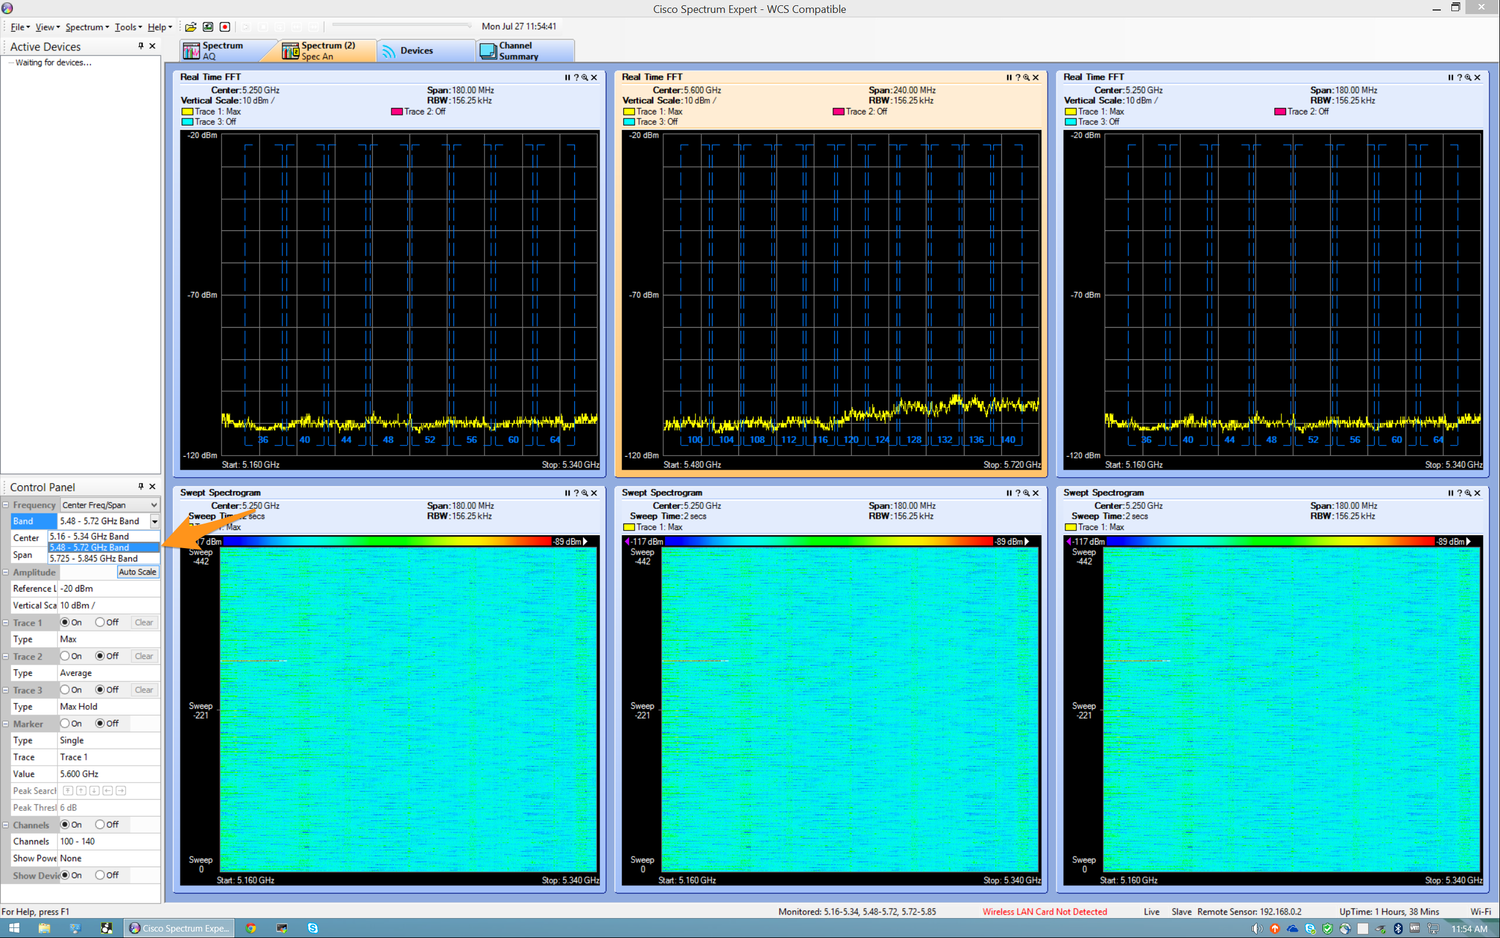
This completes the Real Time FFT configuration, next, the Swept Spectrogram Plots.
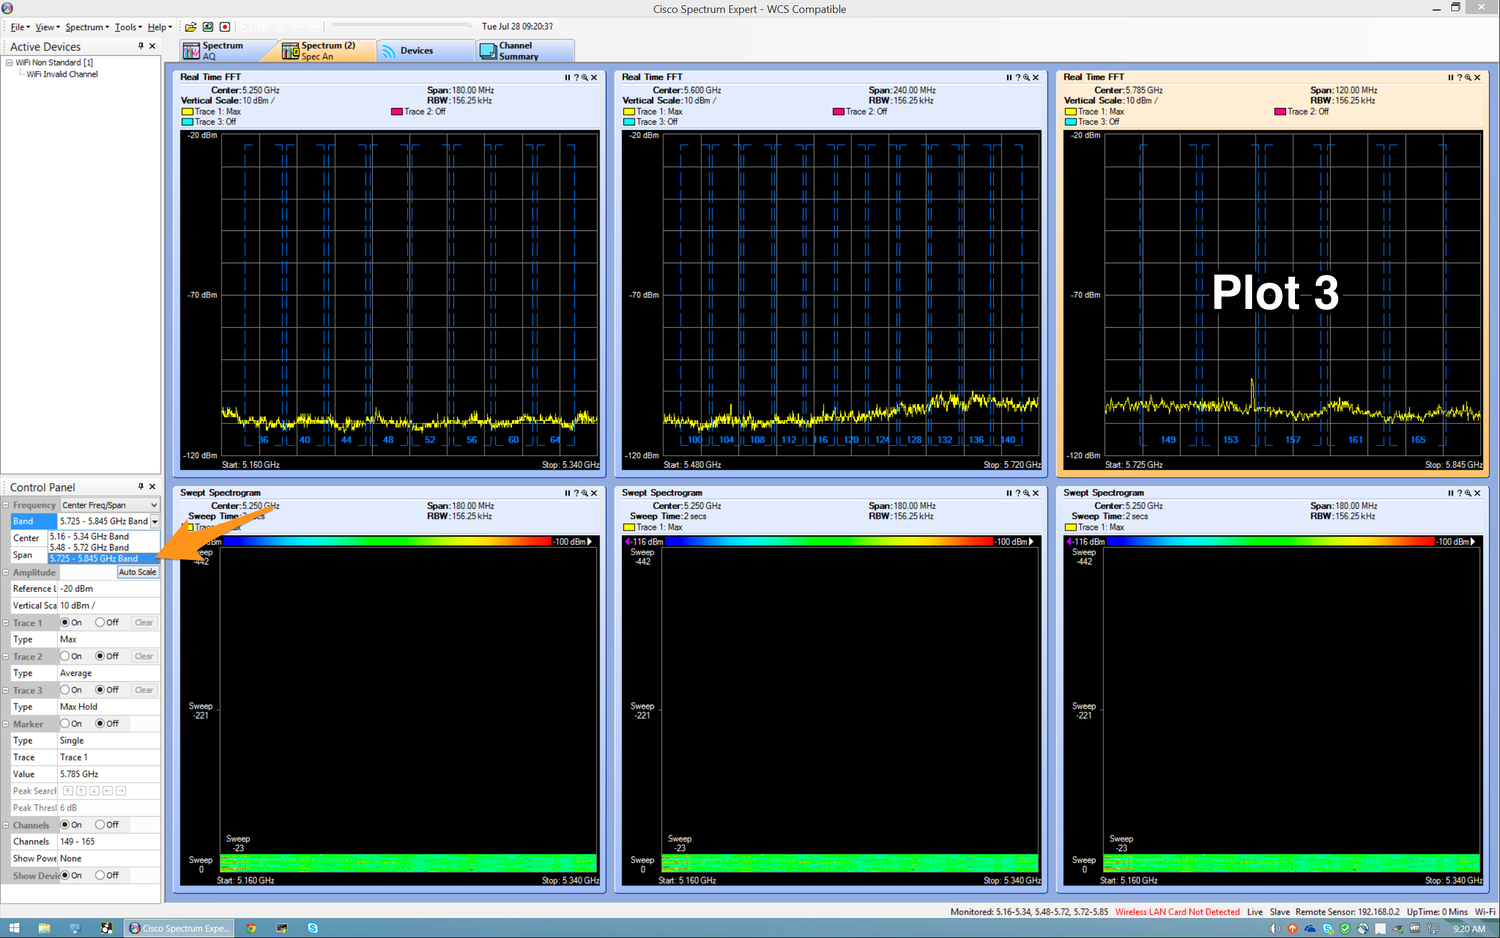
This is now applied to the remaining Plots 5 and 6.
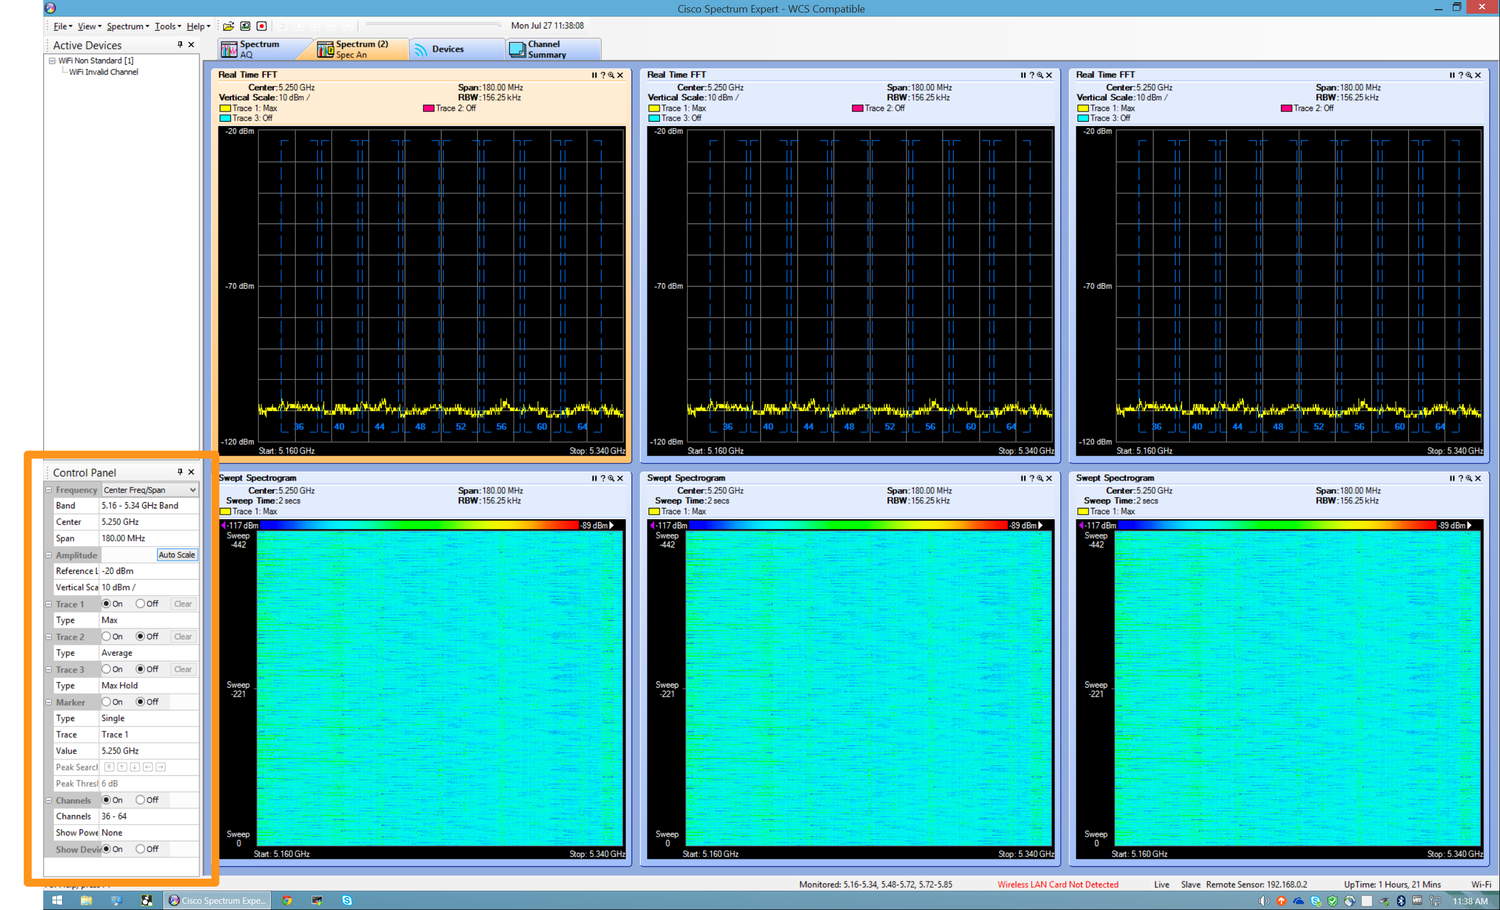
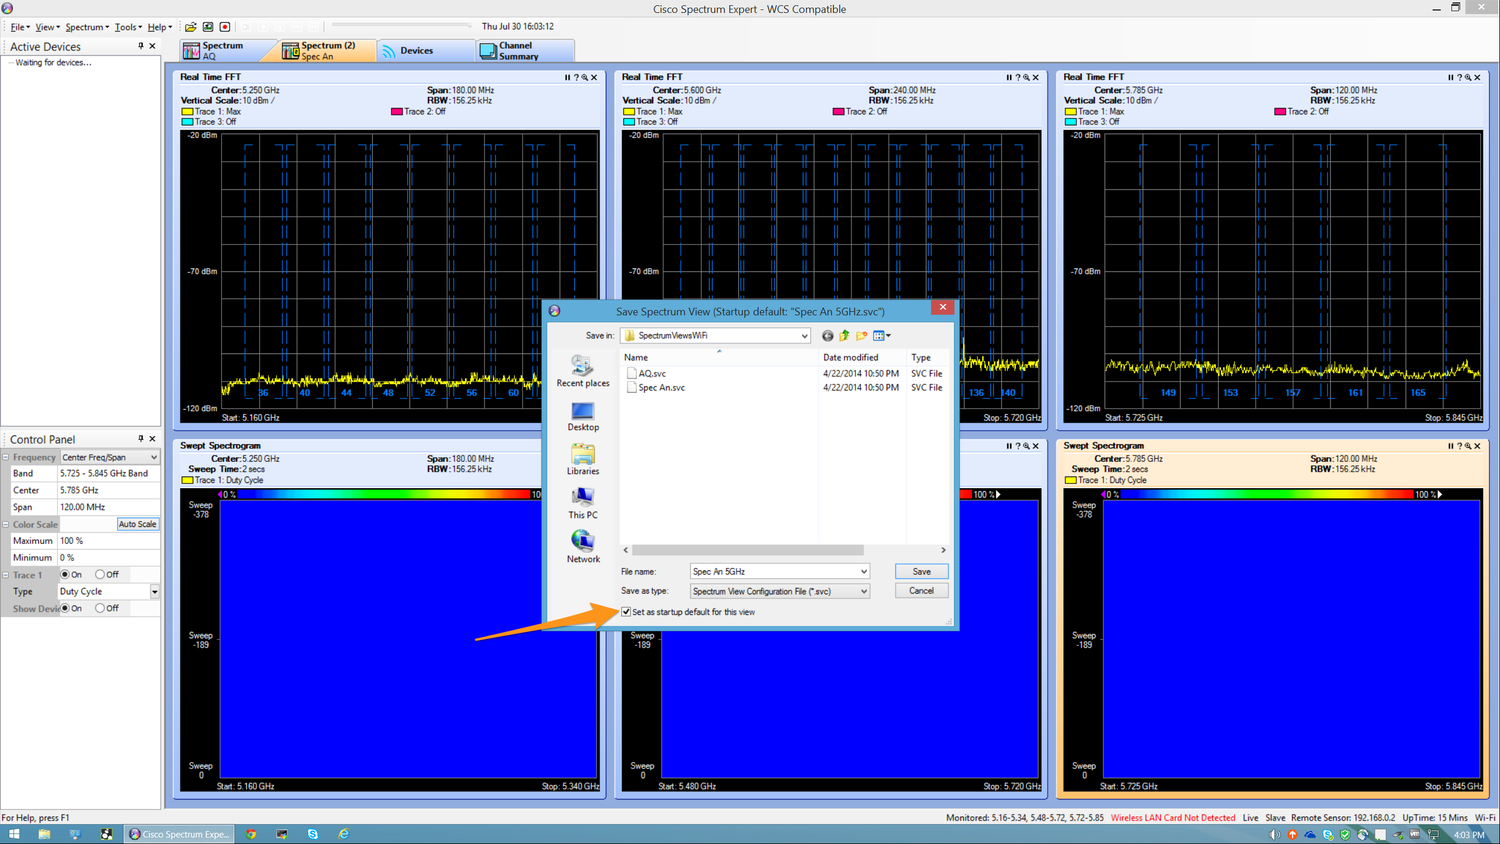
Once You have played around and configured the plots to your liking, save the layout so you can retrieve it next time.
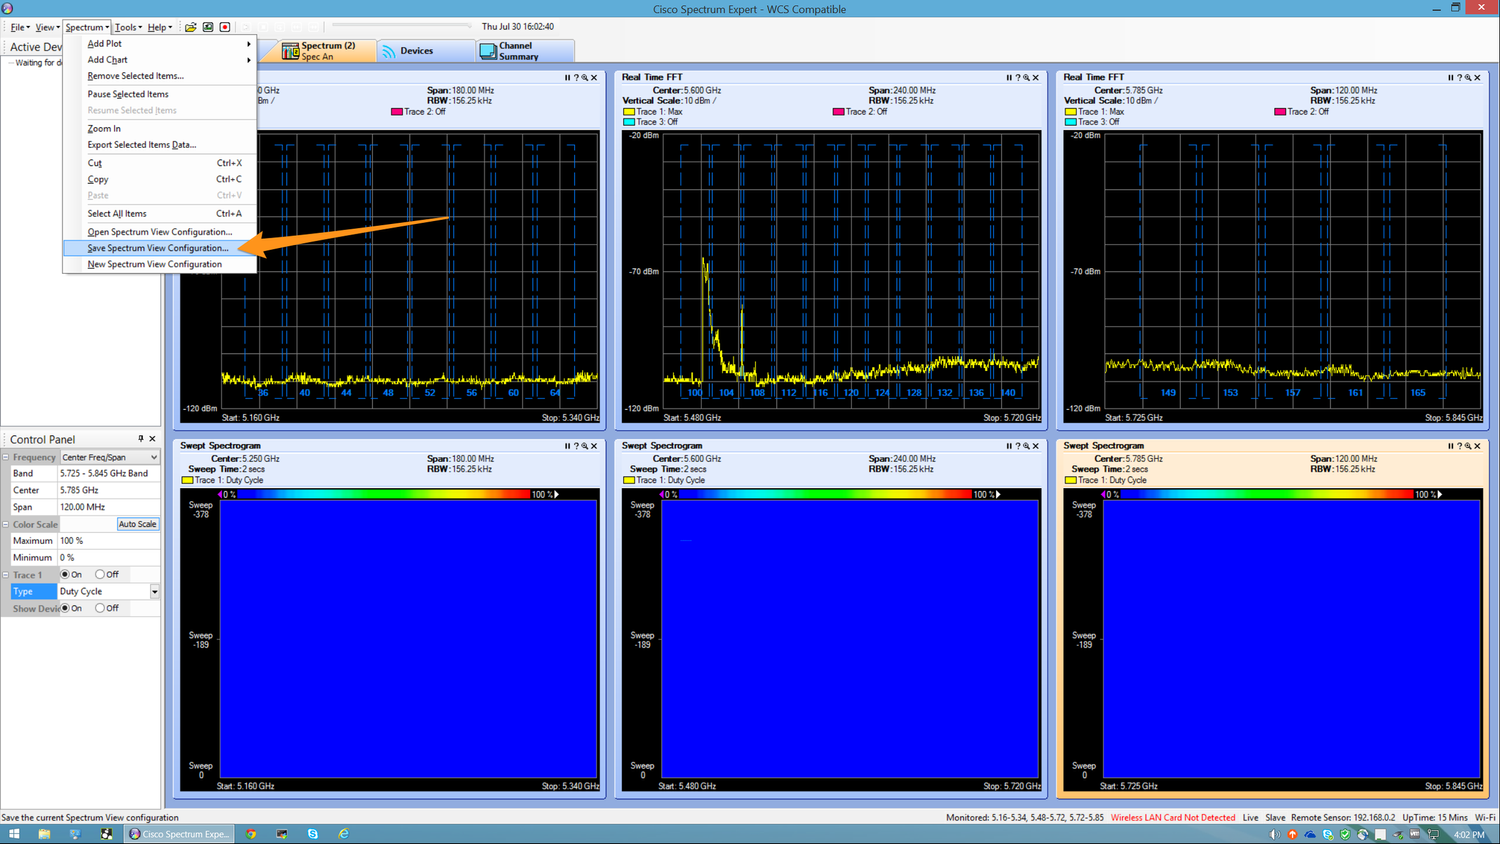
It is easy to open up an alternative view from that same menu.
If you use Spectrum Expert and would like to share any comments regarding how you use or configure CSE, please leave comments or Tweet me @nickjvturner